
|
|
|
|
|
|
Shark Info (12-15-1999) |
Author |
|
Intro: |
Shark Info |
|
Main article: |
Dr. E. K. Ritter |
|
Article 1: |
Shark Info |
|
Article 2: |
Harald Gay |
|
Fact Sheet: |
Dr. E. K. Ritter |
|
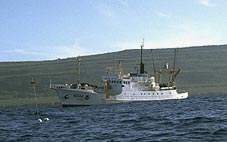
U.S. Government Shark Research ProjectReport by Shark Info BackgroundCommercial shark catches rose in the western North Atlantic and the Gulf of Mexico between 1979 and 1989 from 135 tons to 7,122 tons. During the same period sharks caught by anglers declined from 11,512 tons to barely 1,665 tons, as indicated by a 1993 study conducted in U.S. territorial waters by the National Oceanic and Atmospheric Administration (NOAA) of the U.S. Government. How can such a contradictory development be explained? The rise in commercial catches was undoubtedly caused by a rising demand for shark products, which means they were caught more intensively using more efficient fishing methods. The simultaneous decline of catches made by anglers was, however, a clear warning signal that shark populations were being decimated by unregulated regional commercial fishing. To protect the remaining shark populations, the National Marine Fisheries Service (NMFS, a division of the NOAA) developed a fishing management plan in 1993. To implement the plan it was important to develop a method of determining actual shark populations independent of any statistics prepared by commercial fishing interests in order to monitor the effectiveness of the management plans. One of the first measures was to assign scientific observers to the commercial fishing fleets. At the same time, NOAA developed a pilot project with the purpose of gathering shark population statistics in the impacted regions. Mississippi Labs, a branch of NOAA, was entrusted with the field work, supported by a division of the NMFS, specializing on frequently migrating sharks. Project leader was Mark Grace*, who was kind enough to supply us with information on the project. The Pilot ProjectField work for the Pilot Project was performed from 1995 to 1996, usually from mid to end summer, since a suitable research ship, the Oregon II, was only available during that time period. Unfortunately, this restriction meant that known seasonal fluctuations of shark catches could not be considered in the research work.
The areas to be reviewed regularly were the western portion of the North Atlantic, stretching from Maine to the Florida keys and the Gulf of Mexico, Cuba and the catch areas around the island of Navassa (see map). For this purpose, special cooperative agreements were signed with Cuba and Mexico. To obtain the data, sharks had be caught and tagged. Commercial catch methods could not be applied since the sharks had to be caught very carefully and freed again after the procedure. For this purpose long-lines measuring 1.85 km long were used on the ocean ground. As a rule these had about 100 hooks baited with native Atlantic mackerels (Scomber scomber). However, in contrast to commercial practices the lines were only deployed for about an hour and then hauled in. Radar-reflective buoys were used to locate the long-lines as quickly as possible. The fishing depth measured between 9 and 73 meters in U.S. territorial waters and Mexico, and between 9 and 413 meters around Cuba and Navassa. Fishing took place in 24-hour shifts. In each arbitrarily selected fishing ground, physical and chemical profiles were made of the water columns and atmospheric data was collected.
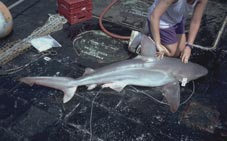
To investigate animal populations it is important to catch, tag, release and later to recatch as many animals as possible. Population sizes can be estimated by statistically analyzing tagged and untagged animals. However, markings are also important aids to gain information on migrations and to find out which populations may move out of territorial boundaries. The markers deployed by the Mississippi Laboratories are engraved with a request addressed to fishermen to report to the NMFS the identification number, catch location, date and if possible the length and weight of the animals caught. International cooperationThe voyages of the Oregon II offer many scientists a genuine opportunity to come into direct contact with and investigate various shark species. Students, teachers and reputed scientists are regularly invited on board the Oregon II. Researchers from Mexico, Cuba, Canada, Germany, France, England, New Zealand and Switzerland have already had the opportunity to participate in such excursions. Results
During the pilot project - which lasted from 1995 to 1996 - 875 sharks, consisting of 22 different species, were caught. Most could be tagged and released alive back into their natural watery element. The careful handling made possible by this catch method proved to be successful. The most frequently caught species were the Atlantic sharp-nosed shark (Rhizoprionodon terranovae) (about 62%) and the tiger shark (Galeocerdo cuvier) (about 9%). Less than 5% of those caught were hammerhead sharks (Sphyrna sp.), while silky sharks (C. falciformis) and bull sharks (C. leucas) and some other species amounted to less than 1% (see detailed list in table below). The different types of species caught and the various sizes of species members corresponded to commercial fishing data. This was encouraging for two reasons: First, a single ship like the Oregon II could not cover the same territory as an entire commercial fishing fleet. Samples had to suffice. Still, the statistical arbitrary selection of catch locations within a region supplied quite reliable data. Second, the reliability of the methods used suggested the feasibility of also reviewing areas which do not normally belong to the fishing grounds used by larger fleets in order to permit a comparison of death rates of fished and nonfished populations. The encouraging results motivated NOAA to continue with the project. Until the end of the summer 1999 about 2,600 sharks were caught and examined, with most of them released after being tagged. The knowledge level on shark populations in the reviewed areas has grown with each voyage of the Oregon II. By comparing statistics of different years it may soon be possible to calculate development trends for regional shark populations and hence to establish meaningful catch quotas. Hopefully this will lead to a future for both fishermen and sharks, preventing unemployment on the one hand, while ensuring that sharks are not overfished and decimated on the other hand.
* Mark Grace is a fish biologist and has been Project Leader of the NMFS Mississippi Laboratories Shark Study since its founding in 1995. He began his career at NMFS as a scientific observer on Japanese long-line tuna catchers who fished in U.S. territorial waters. May be published only by indicating the source: Shark Info |
||||||||||||||||||||||||||||||||||||||||||||||||||||
|
|
|
|
|
|||||